In order to work with synthetic data, it is important to prove that the synthetic dataset maintains key relationships, trends, and patterns present in the real dataset. Several utility metrics have been proposed and used to evaluate synthetic data, however, none have been validated to compare synthetic data generation (SDG) methods.
There are two types of utility metric: narrow and broad. Narrow metrics are also referred to as workload-aware utility metrics because they focus on a specific analysis, such as evaluating the difference in model prediction accuracy between real and synthetic data. However, during data generation, the workloads are often unknown. Therefore, the SDG methods cannot typically be compared by narrow metrics directly.
Broad utility metrics are not based on a specific analysis. Instead, broad utility metrics compare the real and synthetic datasets in based on their relationships, trends, and patterns in an analysis agnostic way. Broad metrics can easily be used to evaluate SDG methods, but currently there is no published evidence that they are predictive of narrow utility metrics.
Our recent study addresses this problem by assessing the ability of broad model-specific (pertain to a generative model) utility metrics to rank SDG methods. Specifically, we focus on broad generative model utility metrics. Generative model utility characterizes the average utility across multiple synthetic data sets that are produced from a given generative model. Given the stochasticity of SDG, such utility metrics are more appropriate for evaluating, comparing, and selecting among SDG models. We assess the performance of SDGs when the synthetic data will be used for logistic regression prediction models, which are common workloads in health research.
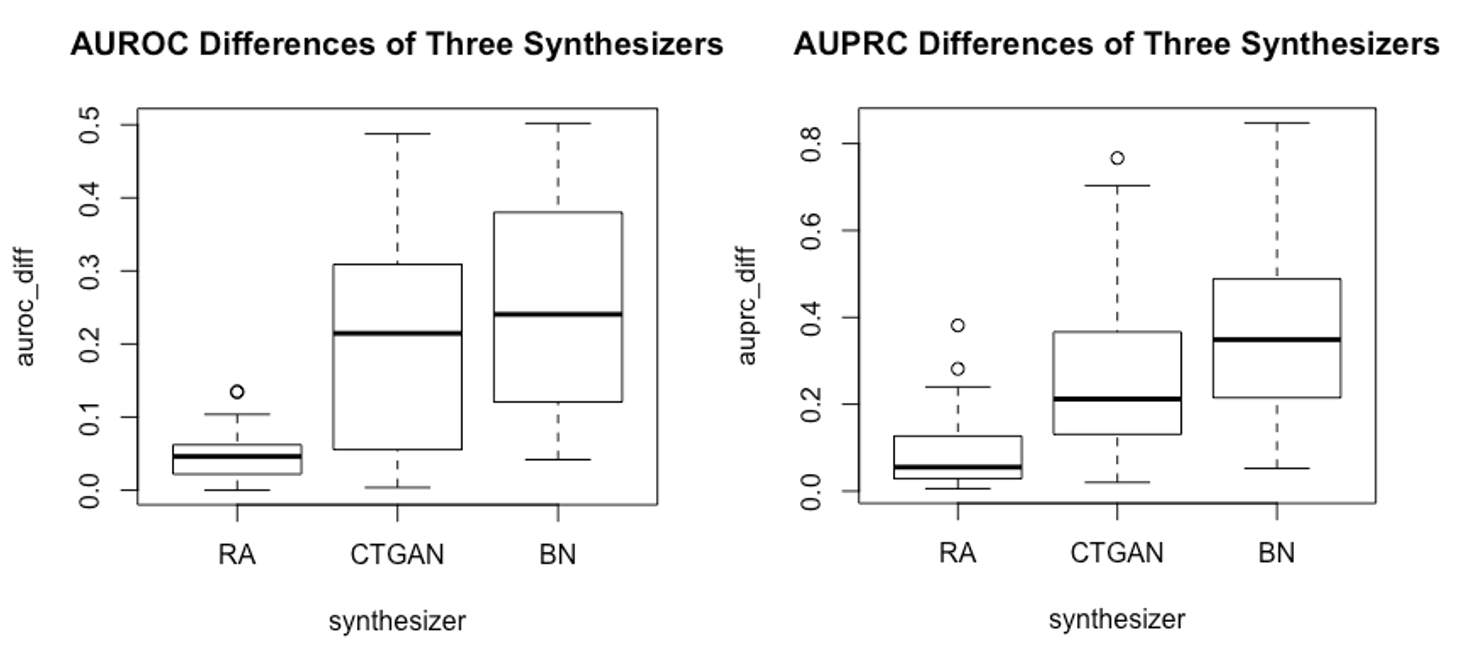
In our analysis, we used thirty health data sets. These data sets have a wide range of sizes, from 87 to 44842 patients and large variation in data set complexity. We assessed five popular broad utility metrics: Maximum Mean Discrepancy (MMD), Multivariate Hellinger Distance, Wasserstein Distance, Cluster Analysis Measure, and Distinguishability Metrics. The difference of AUROC and AUPRC values predicted by logistic regression in real and synthetic data was used as our model-specific (narrow) metric.
Three popular, but distinct, model-based SDG methods were used in the validation study: conditional GAN, Bayesian network and a sequential tree-based synthesis approach developed by Replica Analytics. These SDG methods were chosen to be representative of the diverse types of SDG methods available, applicable to the selected health datasets, and to be varied.
Our results show that across the thirty data sets, all broad utility metrics were able to rank the SDG methods approximately in the order of their narrow utility performance. Specifically, the Hellinger distance has the highest test statistic, suggesting that it has an advantage in ordering the SDG methods (see Figure 1).
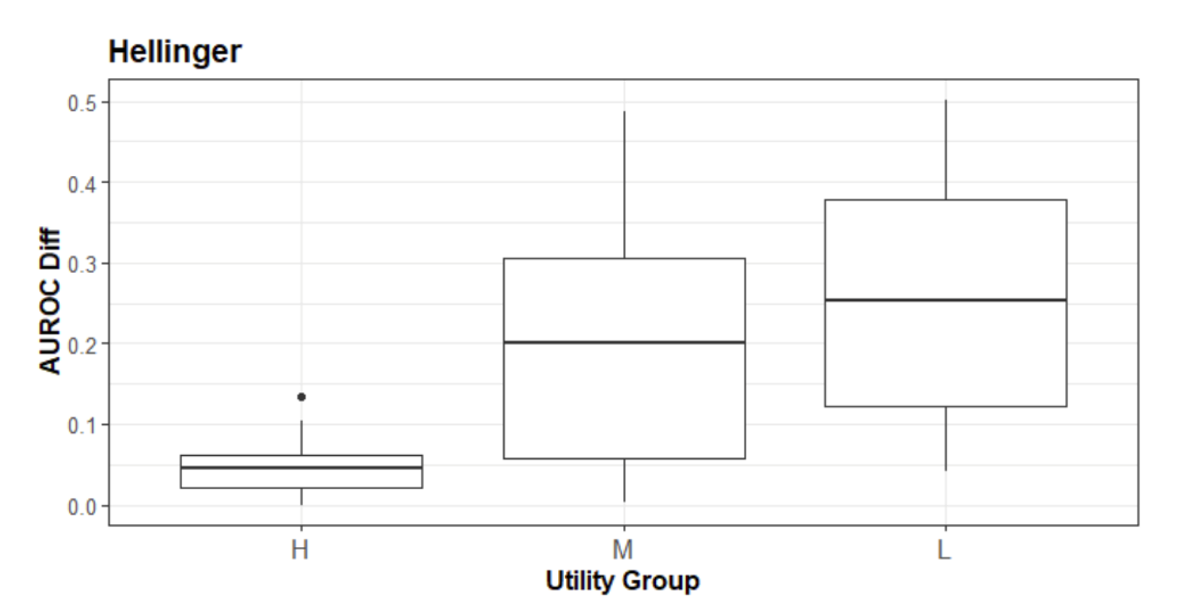
Figure 1: The relationship between the Hellinger distance versus the AUROC. The 3 SDG methods were ordered based on their relative Hellinger distance values into the “H” (High), “M”(Medium), and “L”(Low) groups.
In addition to showing that these broad utility metrics are predictive of a SDG method’s performance in terms of a narrow utility metric, our results showed that the generative approach of sequential synthesis, which is also used in the Replica Synthesis software, consistently had the highest utility (see Figure 2).